Understanding where your surf report data comes from can help you find better waves by improving your ability to:
- Understand what the surf report really means
- Evaluate how accurate it is (and how much to rely on it)
- Make decisions on when and where to surf
Where Does Swell Data Come From?
Data Source: Ocean Buoys
Swell size and period data comes primarily from buoys out at sea.
This is what an ocean buoy looks like:
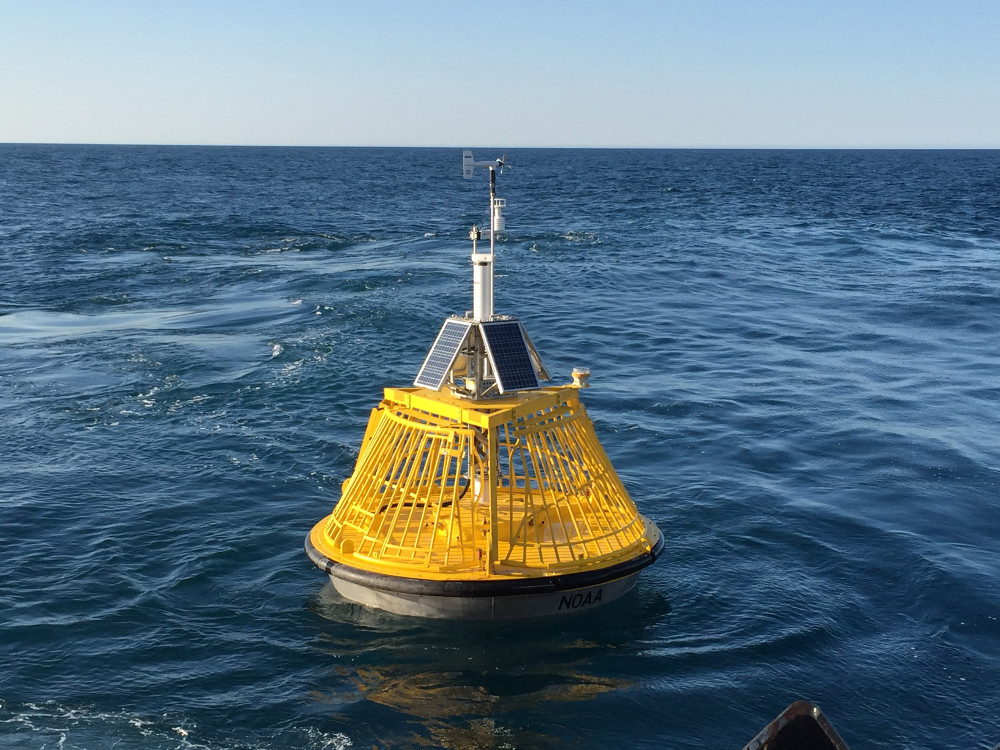
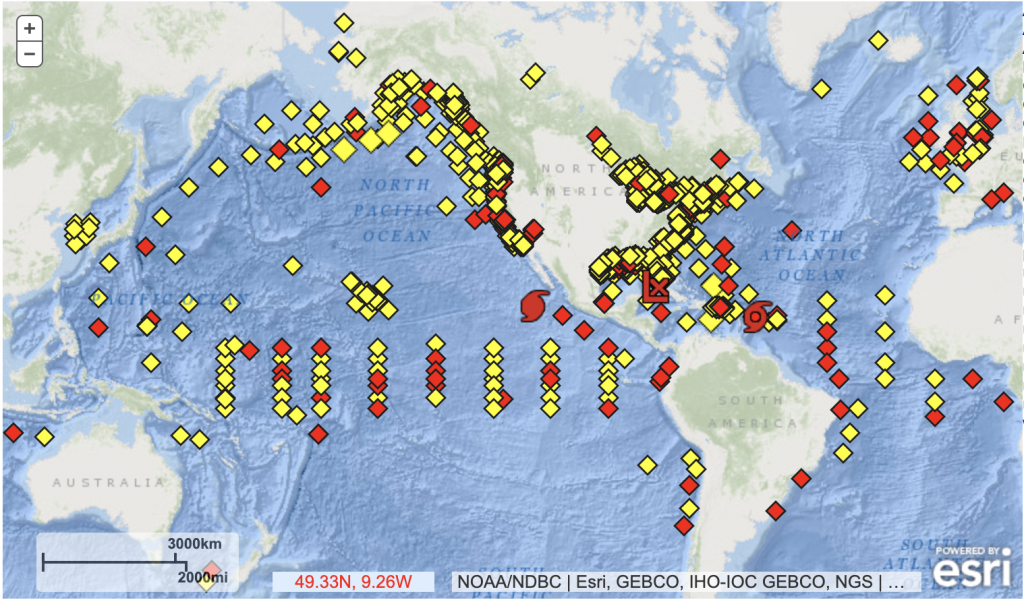
There are hundreds of buoys around the world. A large portion of them are placed and maintained by NOAA – the National Oceanic and Atmospheric Administration. There is a dedicated program for managing the buoys and the data that comes from them – the National Data Buoy Center.
Map of NOAA Buoys
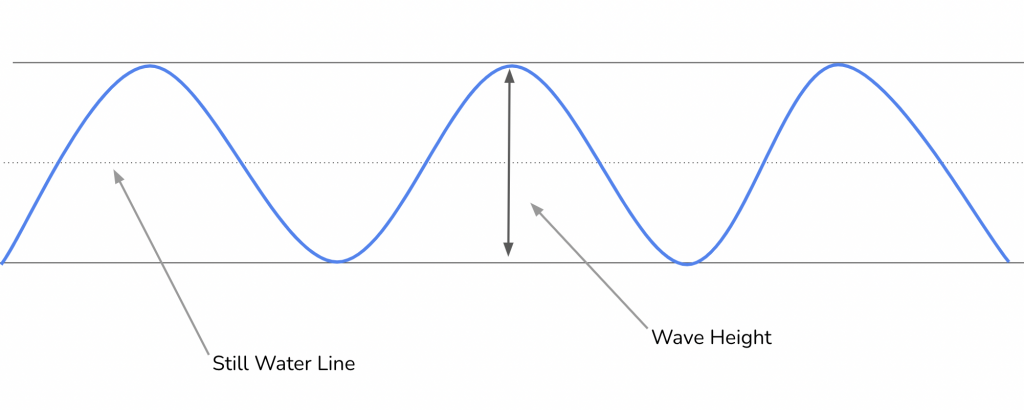
How Does A Buoy Measure Swell Height?
Ocean buoys are equipped with various sensors that help them capture data about the sea conditions around them.
The two sensors used for capturing swell height are:
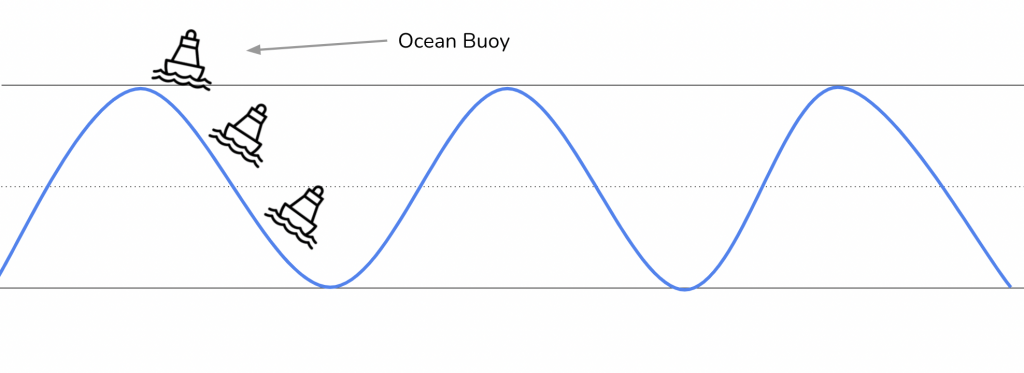
- Accelerometers (Most Common) – measure up and down movement as waves roll past them.
- Water Pressure Sensor Arrays (Less Common) – measure water pressure as waves move over them.
The movement of the buoy also captures sea surface elevation which can be used to estimate swell height.
Buoy data comes from NOAA in raw format that looks like this:
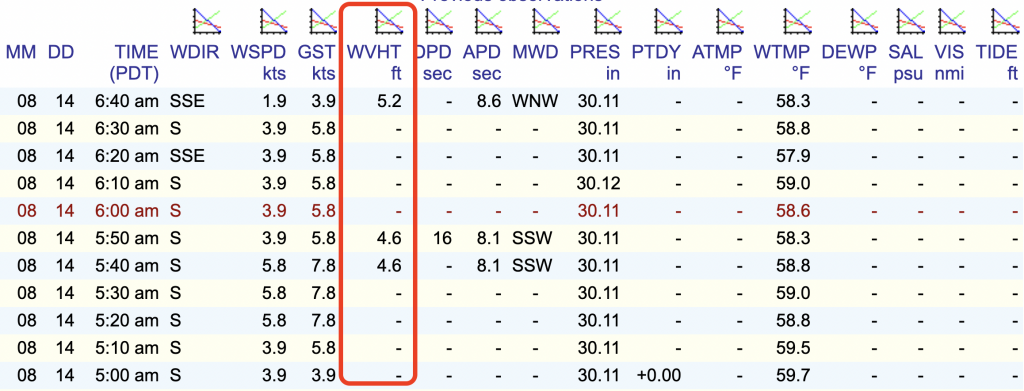
As you can see there is much more data than just wave height (WVHT). Main Data Points:
- Time
- Wind Speed and Direction
- Water Temperature
- Swell
- Height
- Period
- Direction
Wave-Related Data
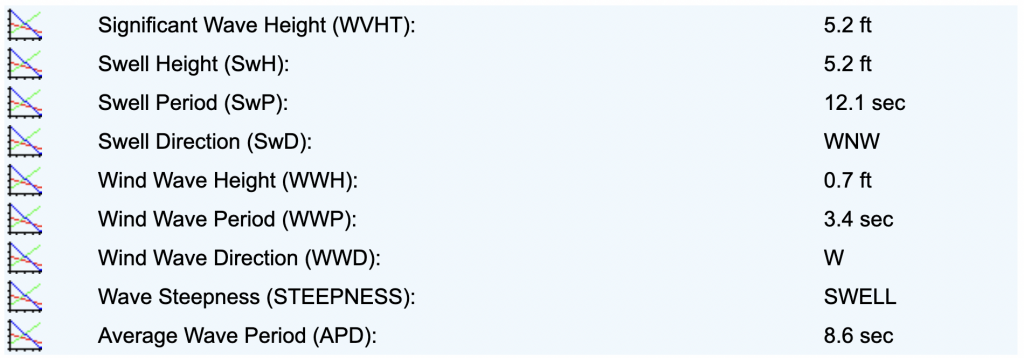
This data gets pulled in by surf reports and translated into a report that is “surfer friendly”.
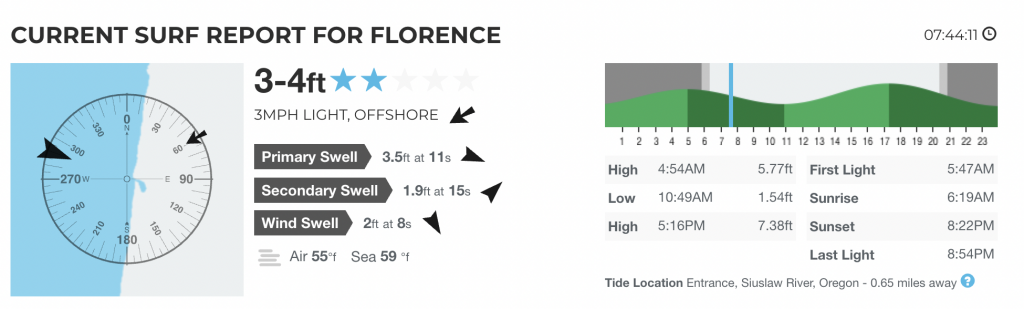
Some of this information is just raw data from the most relevant buoy, formatted and visualized in a way that is relevant to surfers.
Surf forecasts, however, are the result of a combination of data points that are evaluated to come up with a prediction of surf conditions for a specific area.
How do surf reports combine data?
Surfline is famous for its LOLA wave forecast system and is a great example of how websites like surfline turn buoy data into surf reports.
LOLA is a proprietary model created by surfline. It is essential an algorithm that takes in various data points and provides a surf and swell forecast. The main data points it uses are buoy data and bathymetry (ocean floor contours that affect how waves break at different beaches).
The forecasting algorithms of services like Surfline are a bit of a black box. The only information the company reveals is that certain data goes in and a “reliable” surf forecast comes out. It isn’t clear how many buoy data sources they use or how they calculate it… however, I do have some modeling experience as part of what I studied in college (GIS), so I may be able to shed a little more light on this.
How surf reports like LOLA are generated:
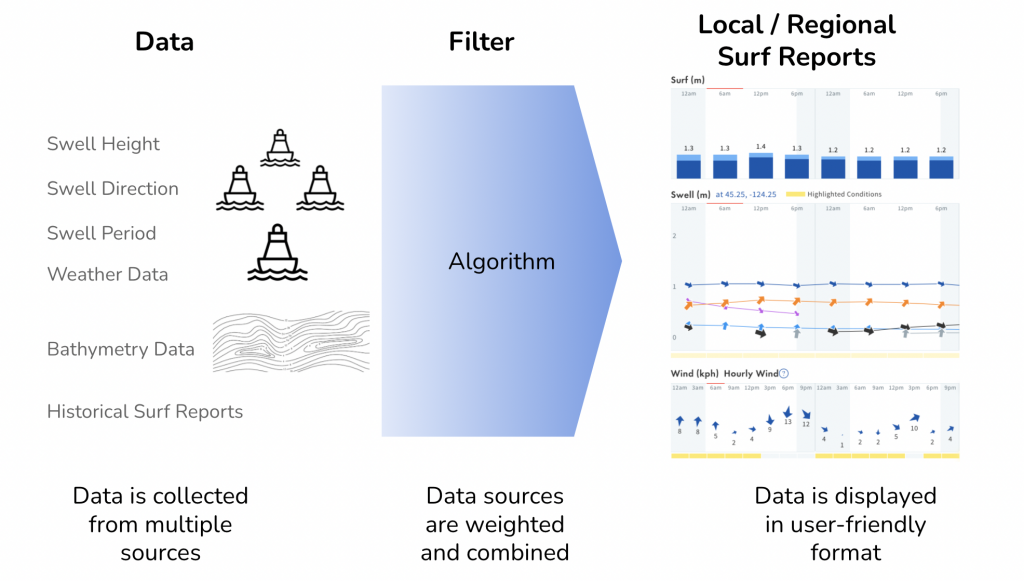
What happens in the algorithm filter?
- Data is weighted – some data is more important of a contributor to swell height and quality than others.
- Data is calculated – some calculations are made to estimate the outcome of multiple swell types merging together. Data points like swell height, speed, and changes in conditions over time can feed calculations to extrapolate the life of a swell into the future.
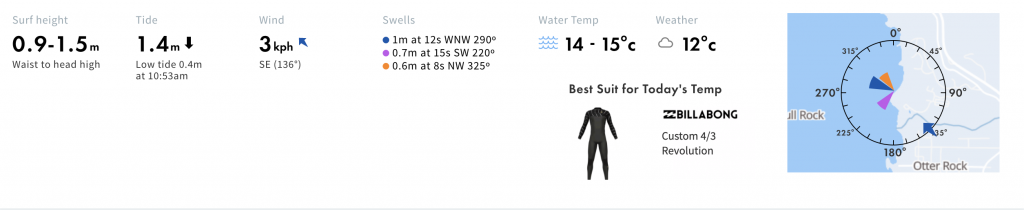
- Some metrics are converted – some metrics may be converted into surfer-friendly terminology.
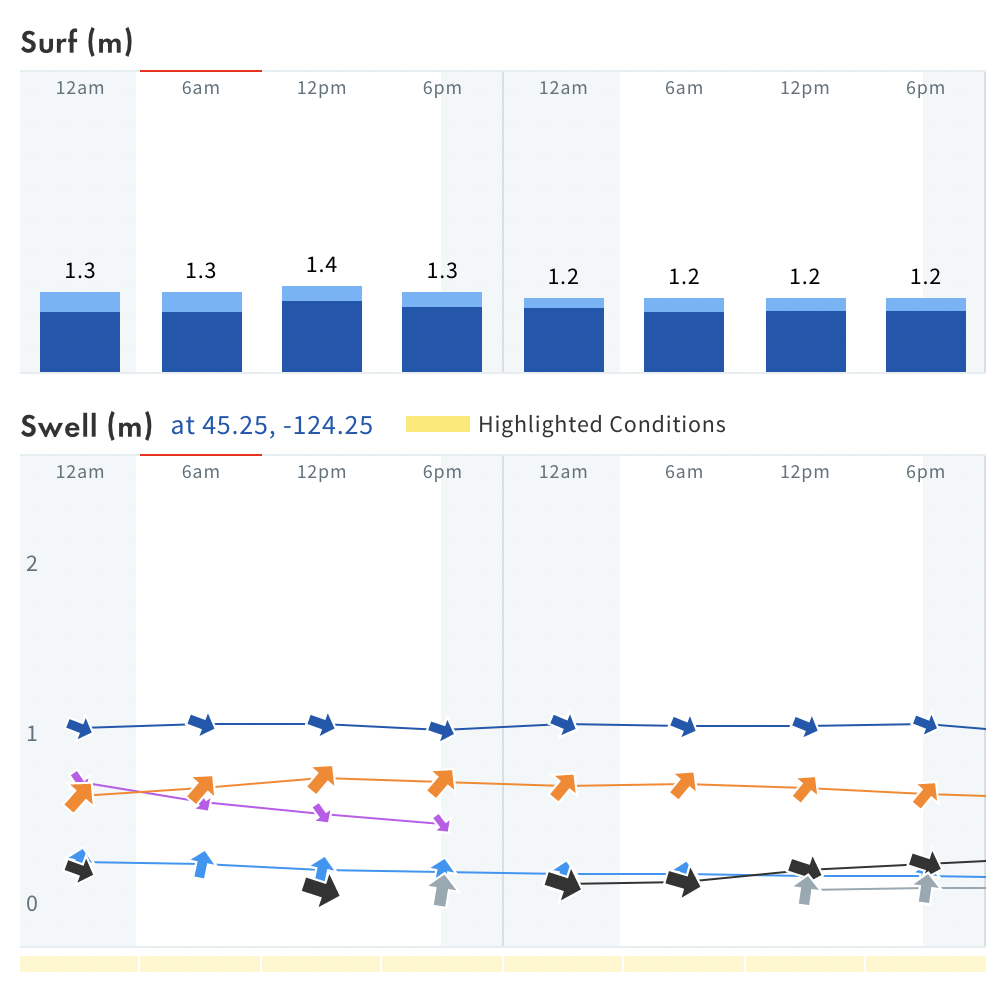
The outcome is a surf report that is often as simple as a color and surf size range by the day.
Knowing that there are so many different variables can help in several ways:
- Forecasts change – you should view forecasts as dynamic, rather than an accurate prediction of what will come in the next few days. Just like tracking a hurricane, meteorologists may have a good idea of where it will go and how strong it will be, but there are so many variables that things can change at any moment.
- Accuracy is different by location – some places like the coasts of the US have a large amount of buoy data to evaluate, while other locations only have a few. So some surf breaks will have more accurate forecasts.
- Local factors – there are other local factors that influence surf. A surf report may give you the swell rating, but you also have to take into account tides and wind conditions.
How I use surf reports
I use surf reports as a data point into my own “Filter”. By combining my own local knowledge of surf breaks with a regional forecast, I can usually have a fairly good idea of what breaks in my area will be best.
As a general predictor for swell events. If I know a swell is generating at a particular size and from a particular direction I will change the surf spots I go to check. I know for my region:
- Certain swell angles make surfing in the northern breaks better
- Certain swell periods break better on reefs rather than beach breaks
- Some swell sizes are too big for certain breaks but very good for others